


Prerequisites
Java Development Kit (JDK) installed on your system.
Have Ubuntu Linux on your machine.
Installation
Install and check Java version
 $ apt-get install openjdk-8-jdk -y
 $ java --version
Install Apache Web Server and then start an Apache Service
 $ apt-get install apache2 -y
 $ systemctl start apache2
 $ systemctl enable apache2
Install and unzip Apache JMeter
 $ wget https://dlcdn.apache.org//jmeter/binaries/apache-jmeter-5.5.zip

 $ unzip apache-jmeter-5.5.zip
Launch the Apache JMeter Application
 $ cd apache-jmeter-5.5/bin

 $ ./jmeter
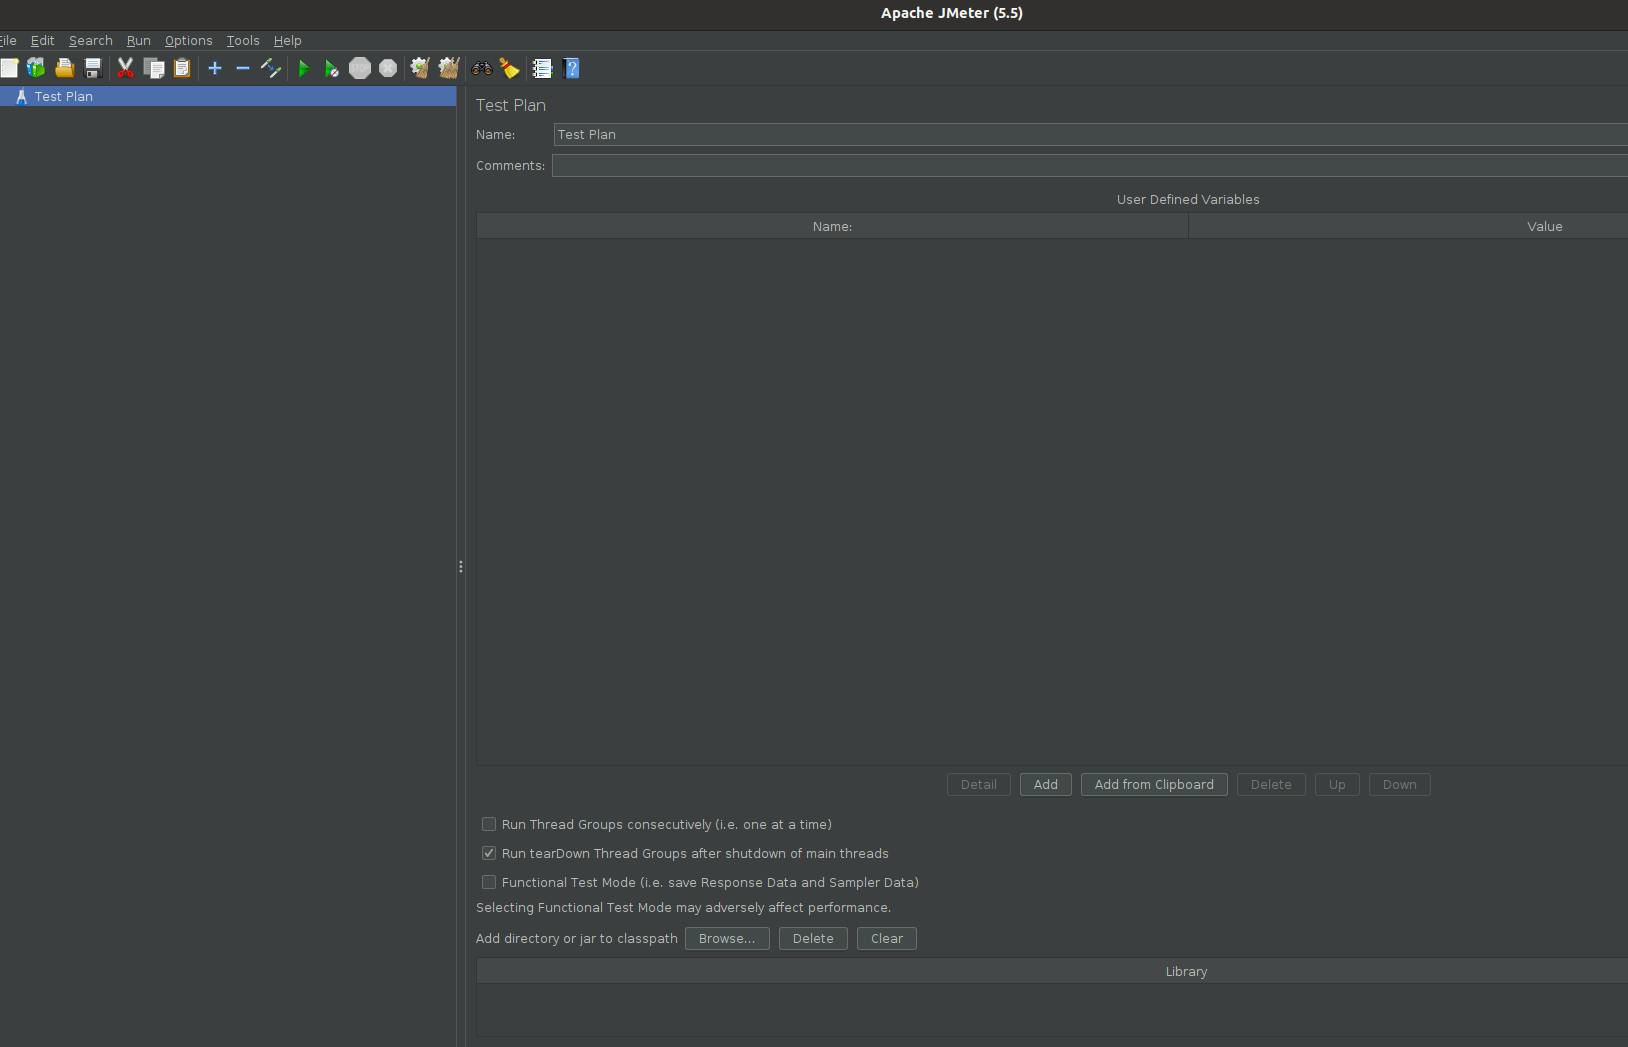
You are all set, your launched app should look like this
Apache JMeter?
Apache JMeter is an open-source pure java application built for load and performance testing. It is popular with Web - HTTP, HTTPS (Java, NodeJS, PHP, ASP.NET) testing. However, it has expanded to accommodate other protocol types such as FTP, database via IDBC, java objects, and REST web services among others. That's a lot of jargon, but it gets easier when we get our hands a little dirty.
Load Testing

Have you been on a very slow web app? How long do you wait on it to respond to that press of a button? How many times will you revisit that web app? Response time on a web application plays a huge role in user retention. System downtimes have seen companies lose money, sales, and traffic. Load testing offers solutions to these common problems. Load testing is a non-functional performance testing that determines a system's breakpoint when accessed by multiple users simultaneously. A "load" or artificial demand is placed on your web application to determine how much traffic it can handle while remaining effective and operational. With load testing, you get to determine the maximum operating capacity of your system, the needed additional resources to improve its stability, and your project's scalability.
Let us run our first Load test on JMeter.
Create a Thread Group
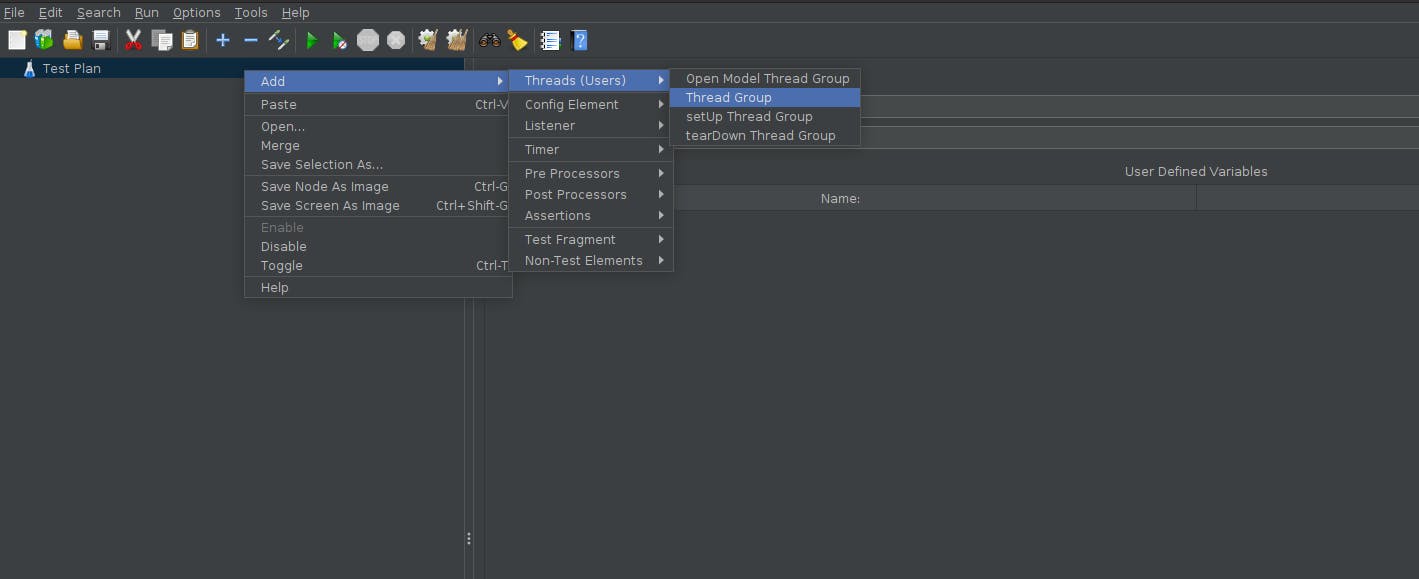
A thread group is a simulation of people using the system under test. Each thread is representative of a real user sending requests to the server. Right-click on the test plan; hover on "Add"; hover on "threads"; click on "Thread Groups" to create a thread group. Each thread group is assigned a set of samplers, controllers and listeners before test execution.
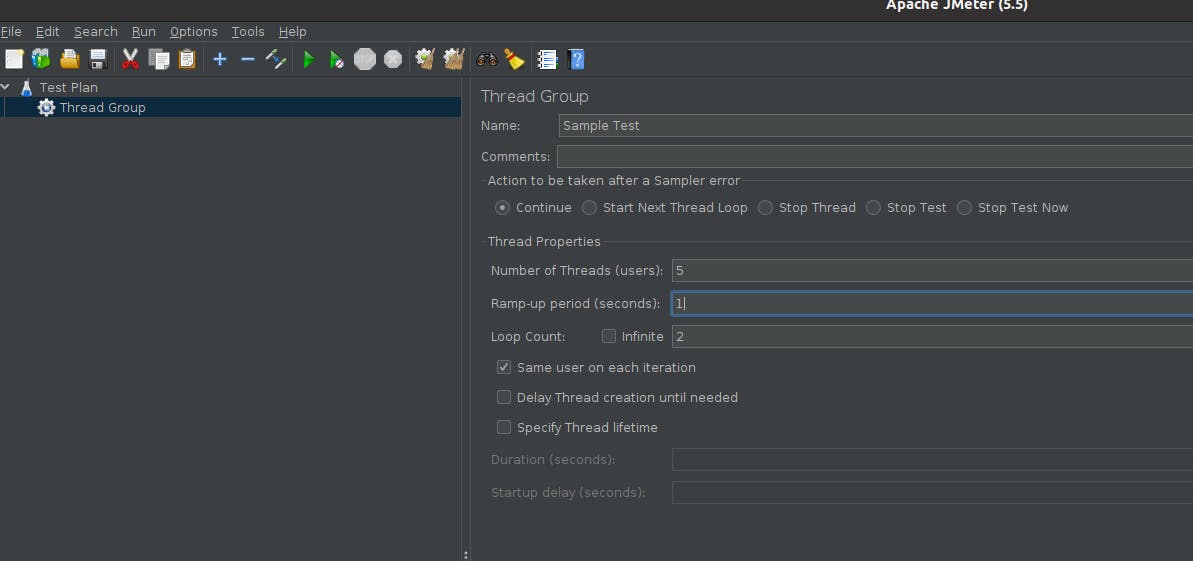
A thread group has three core elements.
a) Number of threads: refers to the number of users JMeter will simulate.
b) Ramp-up period: refers to the amount of time taken to run a thread. For instance, if the ramp-up period is set to 10 seconds for 5 threads, each thread will run 2 (10/5) seconds after the previous thread begins.
c) Loop Count: Loop count refers to the number of times each thread iterates. For instance, 10 threads with 2 loop counts will give a 10*2 output.
Below is an illustration. You are all set to place some load on your system.
Add Controllers to your Thread Group.
JMeter provides two types of controllers: samplers and logic controllers. For this tutorial, we shall focus on the samplers. Samplers identify what kind of request should be sent to the server. For example, if you want to test a landing page, you'll send a HTTP request. However, if you are running unit tests, you'll send a JUnit test. For this case, we shall load test the very popular w3school website... let's see how much load this baby can handle!
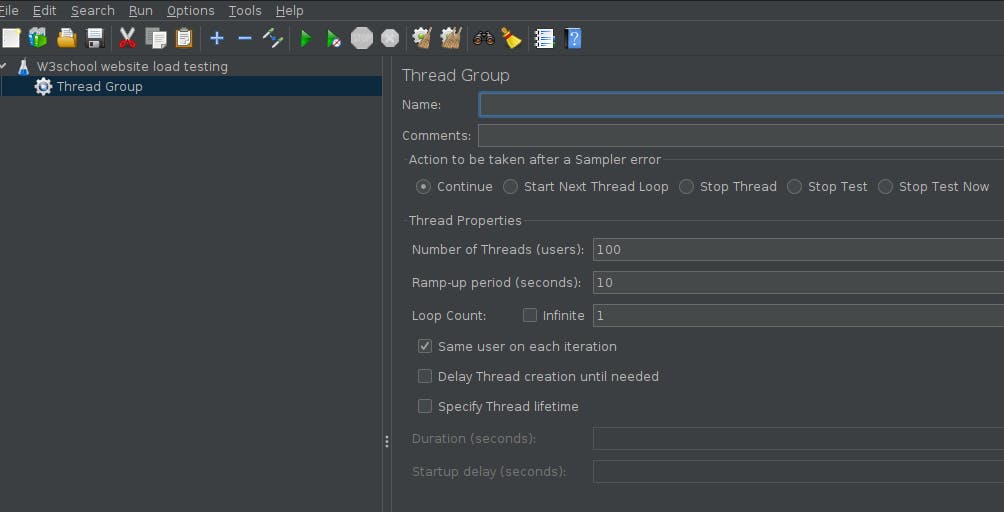
First, let's set up the thread group. Then, right-click on the thread group and add a sampler. From the list of samplers, pick the HTTP request.
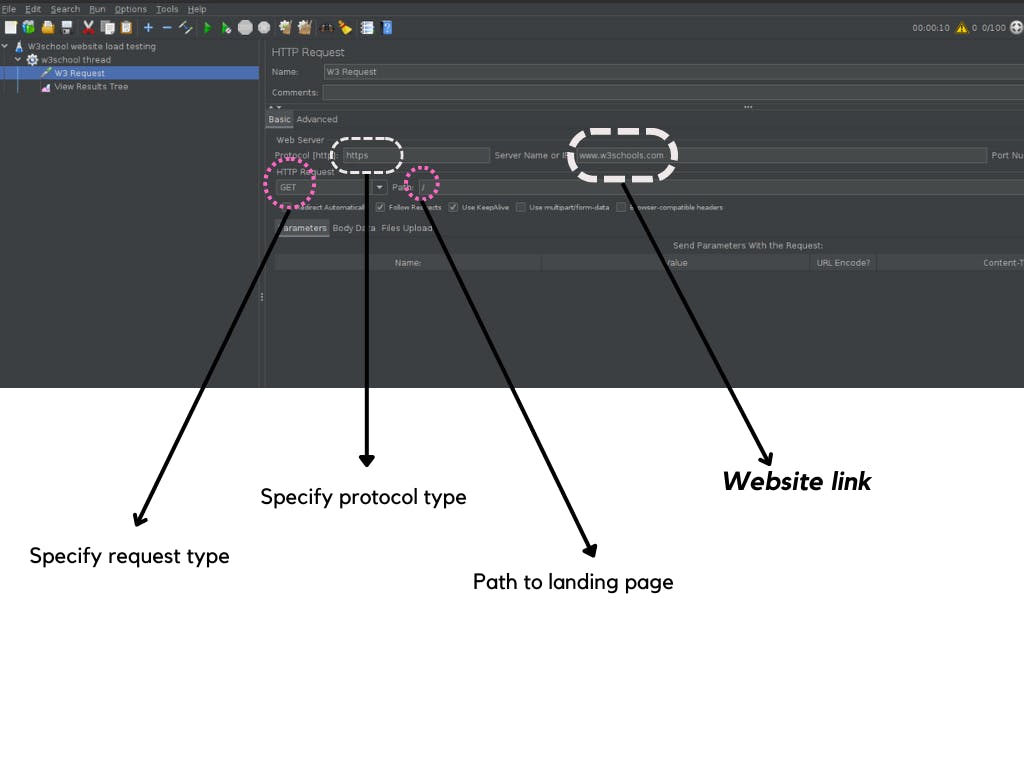
Now, let us set up our HTTP sampler. The sampler requires a few elements to run successfully. It needs a protocol, which we shall set to 'https'. Add a server name which in our case will be "w3schools.com". Notice that we move the https:// and call it in the protocol section. Lastly, add the desired path as shown below.
All done!!! We are ready to load test the website, but first....
Add a listener
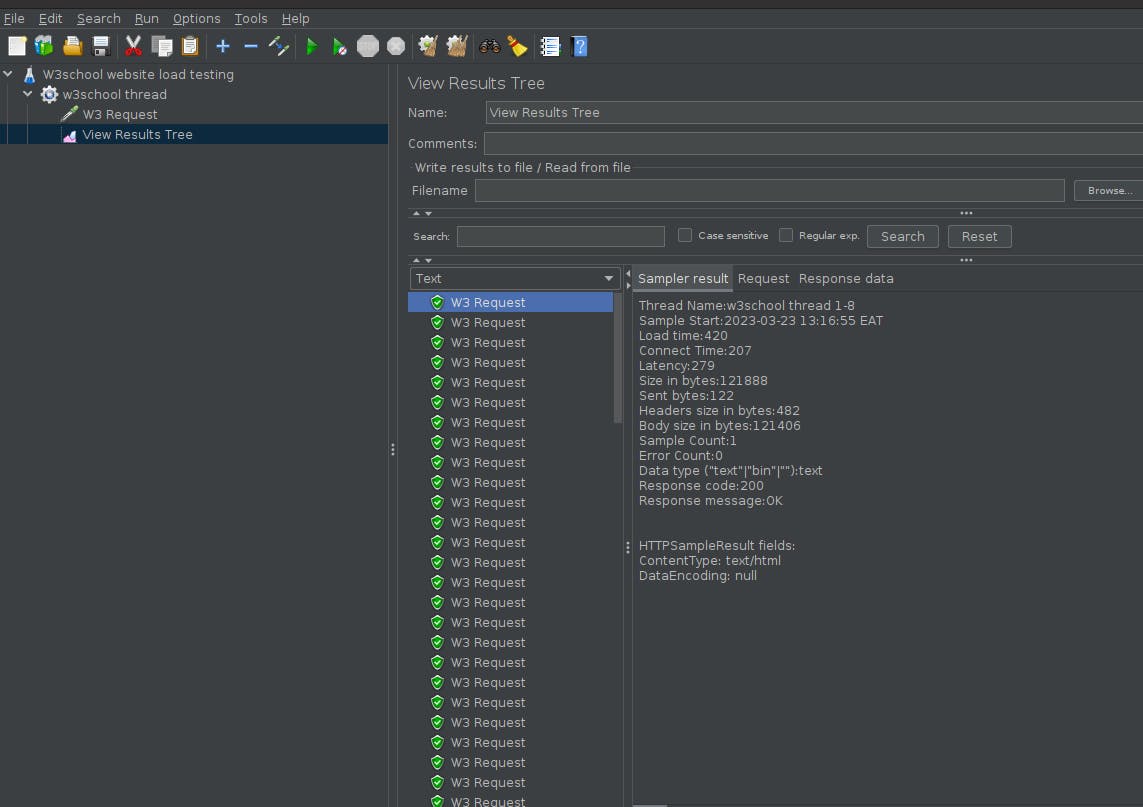
A listener shows the results of the sample. It can either be shown in a graph, tree, table, or log file. It provides details on how a system's load time, connect time, latency, and response data respond to a request. In our case, we shall use a results tree. Right-click on the thread group, add a listener, and pick "view results tree". Run the tests using the green play icon on the top navigation tab. Upon saving your work, the results will be displayed under the view results tab.
How easy was that? These three steps work for API performance testing.
Performance Testing
Performance testing checks that an application meets all its requirements despite the density of its workload. Its implementation ranges from bug detection and elimination to system quality optimization. There are different performance testing metrics provided by JMeter as seen in the sampler results section.
Latency
This is the delay duration before a request is handled. Low latency implies that there are no delays in the system and vice versa is true.
Response time
This is the period a system takes before a response returns. unlike latency, this duration accounts for processing time... You know what they say in the streets, the faster the better. JMeter provided minimum, average, and peak response times based on the amount of data that needs to be processed and the intensity of a load.
Throughput
This refers to the number of requests a system can handle within a specified amount of time. We have highlighted this when building our thread group. The heavier a load a system can handle, the higher its throughput, thus the better its performance.
Bandwidth
This refers to how much data can be received and transmitted per unit of time. Having a high network bandwidth allows for fast transmission of data. However, it does not necessarily translate to optimal performance. However, bandwidth data from JMeter allows you to keep track of traffic on your system.
Error Rate
Error rates determine the frequency of errors in comparison to requests sent. A spike in error rates could signal a problem with an API endpoint or an application reaching its threshold limit.
Conclusion

GO FORTH AND RUN SOME PERFORMANCE TESTS!